



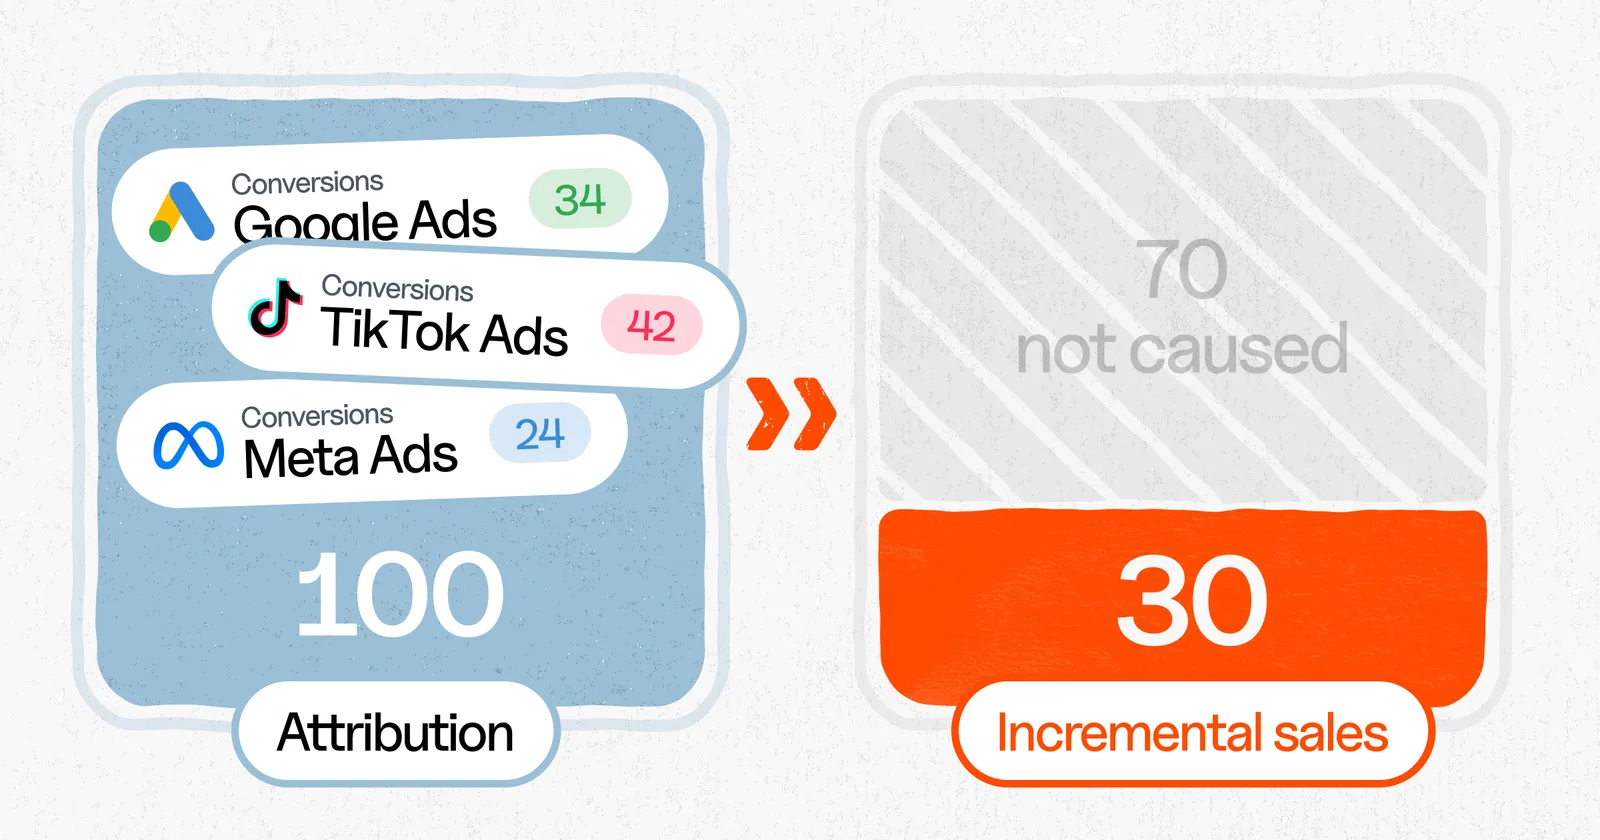
Attribution tells you which ad got the credit for a sale. Incrementality tells you whether the ad caused the sale at all. They are not two versions of the same number. They answer different questions, and confusing them is how good budgets get cut and bad ones get scaled.
I have sat where a lot of founders sit: staring at three dashboards that disagree, trying to decide which channel to scale next week. I spend most of my time now on paid acquisition and the holdout tests that check whether it is actually working. The gap between those two questions, credit versus cause, is where most of the wasted spend I find is hiding.
Incrementality will not give you a clean number to watch every morning. That is not what it is for. What it does is tell you, before you move real budget, whether a channel is earning its money or just standing in the right place when the sale happens.
TL;DR
- Attribution assigns credit. It decides which touchpoint gets the sale in your dashboards. It is fast, granular, and useful for daily optimization, but it cannot tell you what would have happened anyway.
- Incrementality proves cause. It holds a channel back for a group of users or regions and measures the sales difference. The gap is the true incremental effect, the conversions you would not have gotten without the spend.
- Your platform-reported ROAS is inflated. Across published incrementality studies, measured iROAS usually lands 30 to 60 percent below what the platforms report. The worst offenders are retargeting and brand search, because they take credit for demand that already existed.
- There are three ways to measure lift: geo holdouts, in-platform Conversion Lift, and media mix modeling (MMM). They answer different questions at different scales.
- The answer is not one source of truth. The teams getting honest numbers in 2026 triangulate all three: attribution for the day-to-day, incrementality for the causal checks, MMM for top-down allocation.
Attribution answers “who gets credit.” Incrementality answers “what did the ad cause.”
Attribution is a bookkeeping system. When a sale happens, it looks back at the touchpoints the customer passed through and assigns credit according to a rule you chose: last click, first click, data-driven, position-based. Every model is a different opinion about who deserves the sale. None of them is the truth. They are a policy.
That is the part most teams miss. Last-click attribution is not “the real number and the others are estimates.” It is a convention. It hands the sale to whatever the customer touched last, which systematically over-credits the channels that sit closest to the purchase and under-credits everything that created the demand in the first place.
Incrementality asks a harder question. If you had not run this ad, would the sale still have happened? The only honest way to answer it is to withhold the ad from a comparable group and measure the difference. If a channel drives 100 conversions on paper but the holdout still converts 70 on its own, the channel’s incremental contribution is 30, not 100. You were paying for 100 and getting 30.
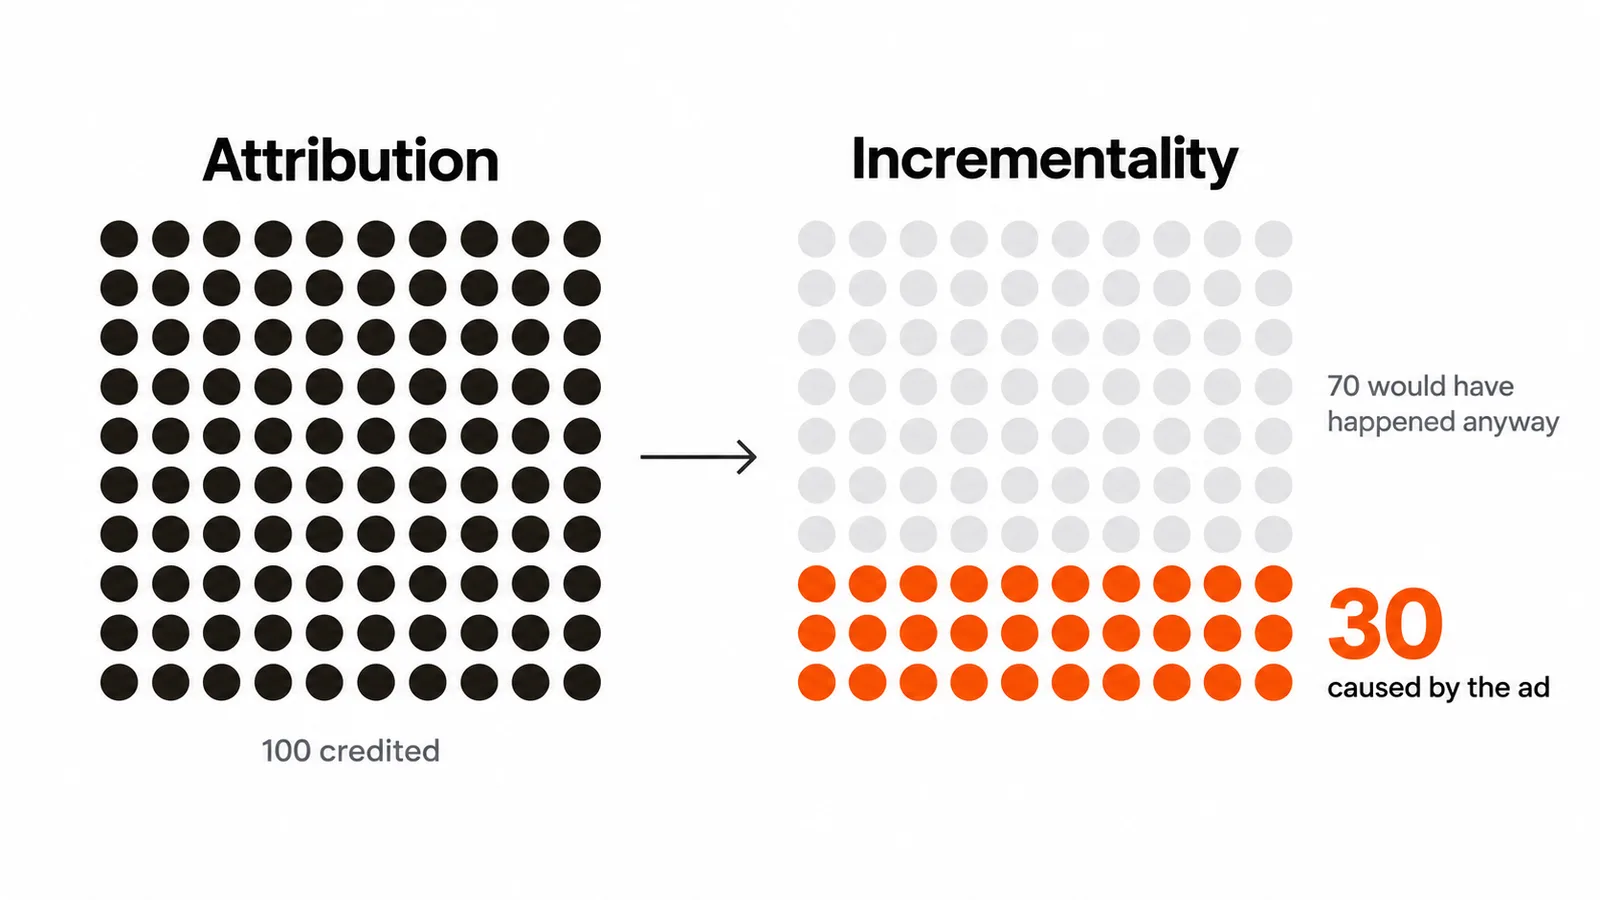
This is not a rounding error. It routinely flips the verdict on a channel.
Attribution vs incrementality, side by side
| Attribution | Incrementality | |
|---|---|---|
| Question it answers | Which touchpoint should get credit? | Did the ad cause the conversion? |
| Method | Rules or models applied to tracked touchpoints | Controlled experiment (holdout vs exposed) |
| What it proves | Correlation | Causation |
| Speed | Real-time, per campaign | Weeks per test |
| Granularity | Per keyword, ad, audience | Per channel or market |
| Best use | Daily optimization and bidding | Budget decisions: scale or cut a channel |
| Blind spot | Counts conversions that would have happened anyway | Needs scale and time to reach significance |
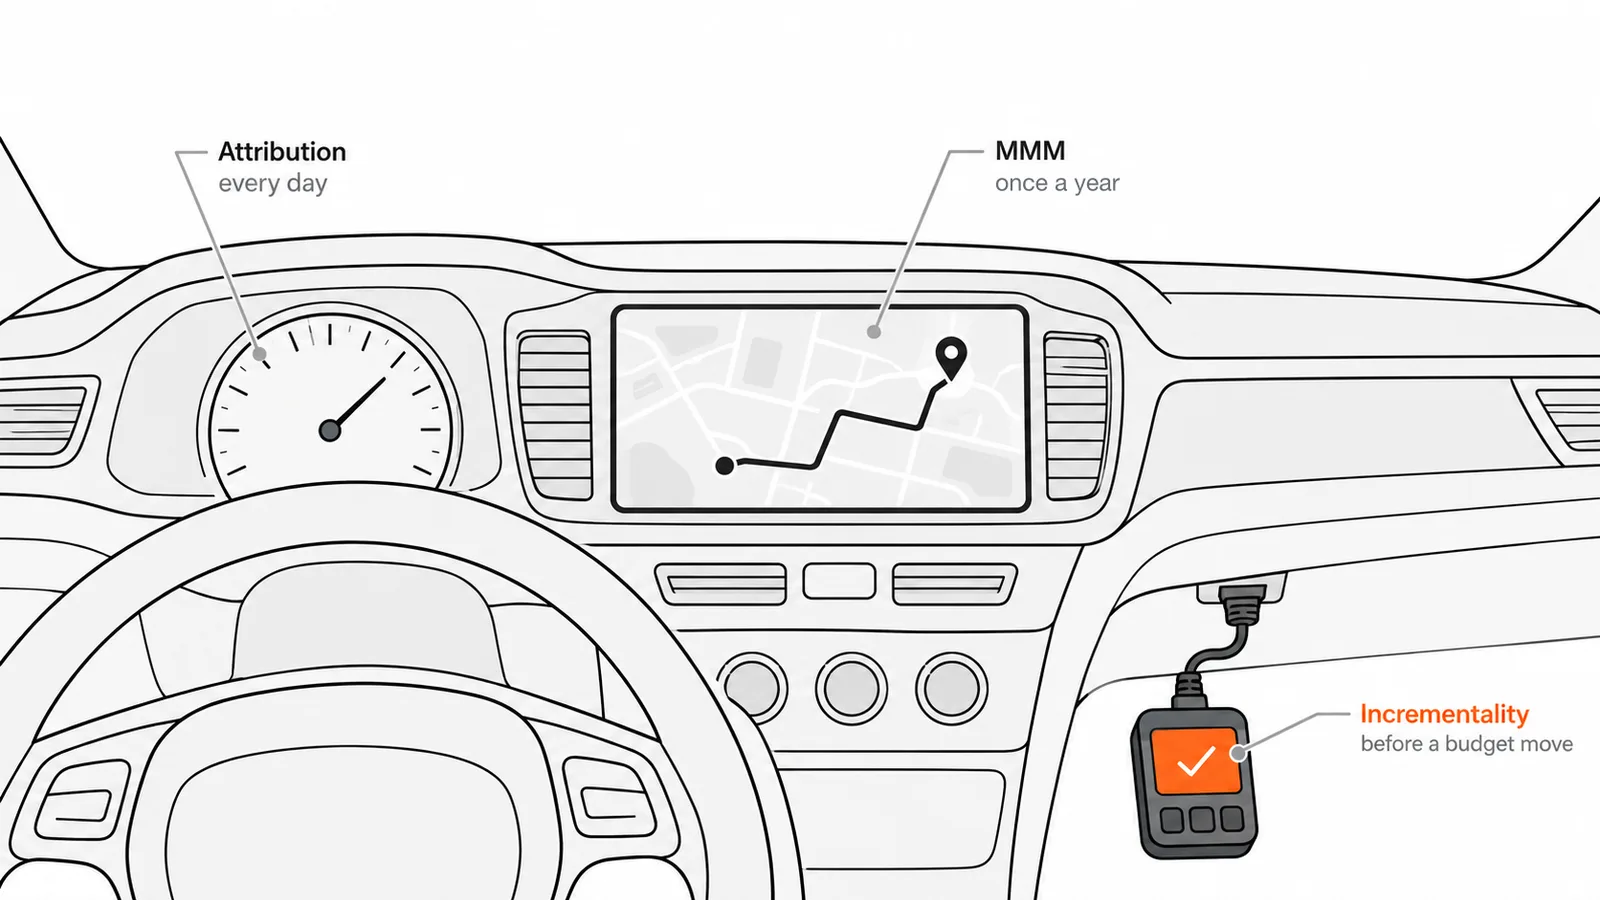
Neither is “better.” Attribution is the speedometer you watch while driving. Incrementality is the diagnostic you run when you are about to make an expensive decision. You need both, and you need to know which one you are looking at.
Why your platform-reported ROAS is inflated
Every ad platform grades its own homework. Google claims a set of conversions. Meta claims another set. TikTok claims a third. Add the dashboards up and you are often counting more sales than actually happened, because the same purchase gets claimed by several platforms at once.
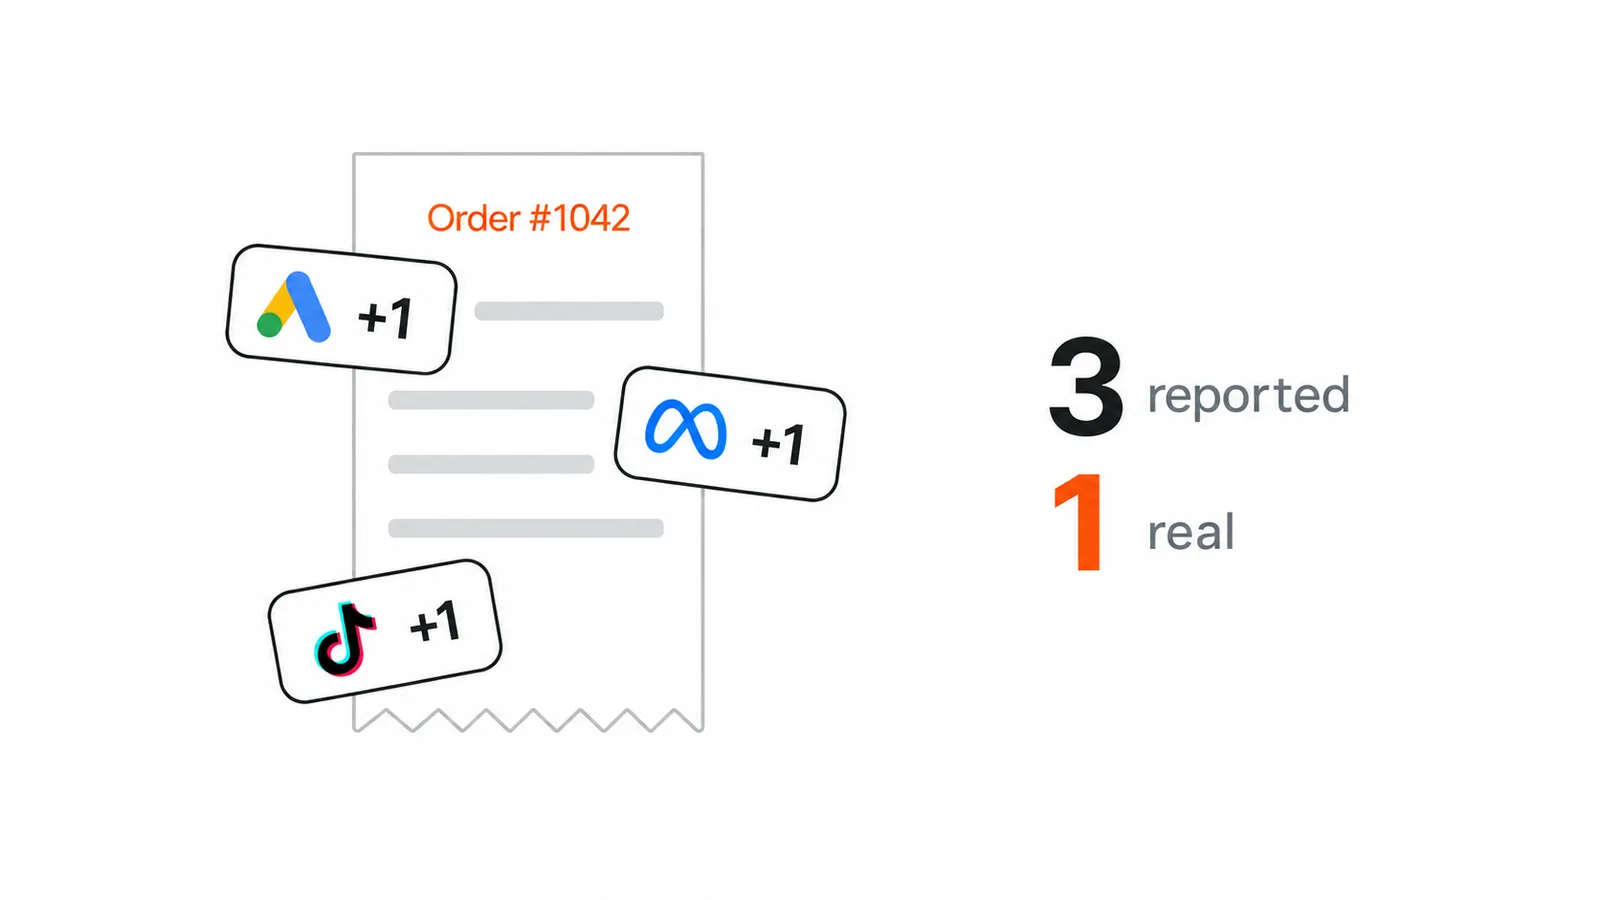
Two forces make this worse than it used to be.
Privacy and signal loss. Since iOS tracking changes and the decline of third-party cookies, the platforms cannot see many of the conversions they used to. They model the gap instead. Industry estimates put the erased, previously-trackable share at 30 to 40 percent. Modeled conversions are not free of value, but they inflate the reported numbers in ways you cannot audit from inside the platform.
Demand harvesting dressed up as demand generation. Retargeting and brand search are the usual suspects. Someone who already has your product in their cart, then sees a retargeting ad, then checks out, gets counted as a retargeting win under last click. Someone who searches your brand name intended to find you anyway. Independent analyses put the over-crediting at roughly 2 to 5x for retargeting ROAS and 60 to 90 percent for brand search.
That is why a channel can look like your best performer in the dashboard and be one of your least incremental in reality. The dashboard is measuring credit. It is not measuring cause.
The gap is not academic. On a channel spending 20.000€ a month, a 40 percent difference between reported and real ROAS is 8.000€ every month you are crediting to the wrong place, and then reallocating budget toward. Over a year that is the cost of the answer many times over.
If you have not yet fixed the data layer feeding these platforms, start there. No amount of incrementality testing fixes a broken pipeline. Clean server-side tracking is the foundation the rest of this sits on.
The three ways to actually measure incrementality
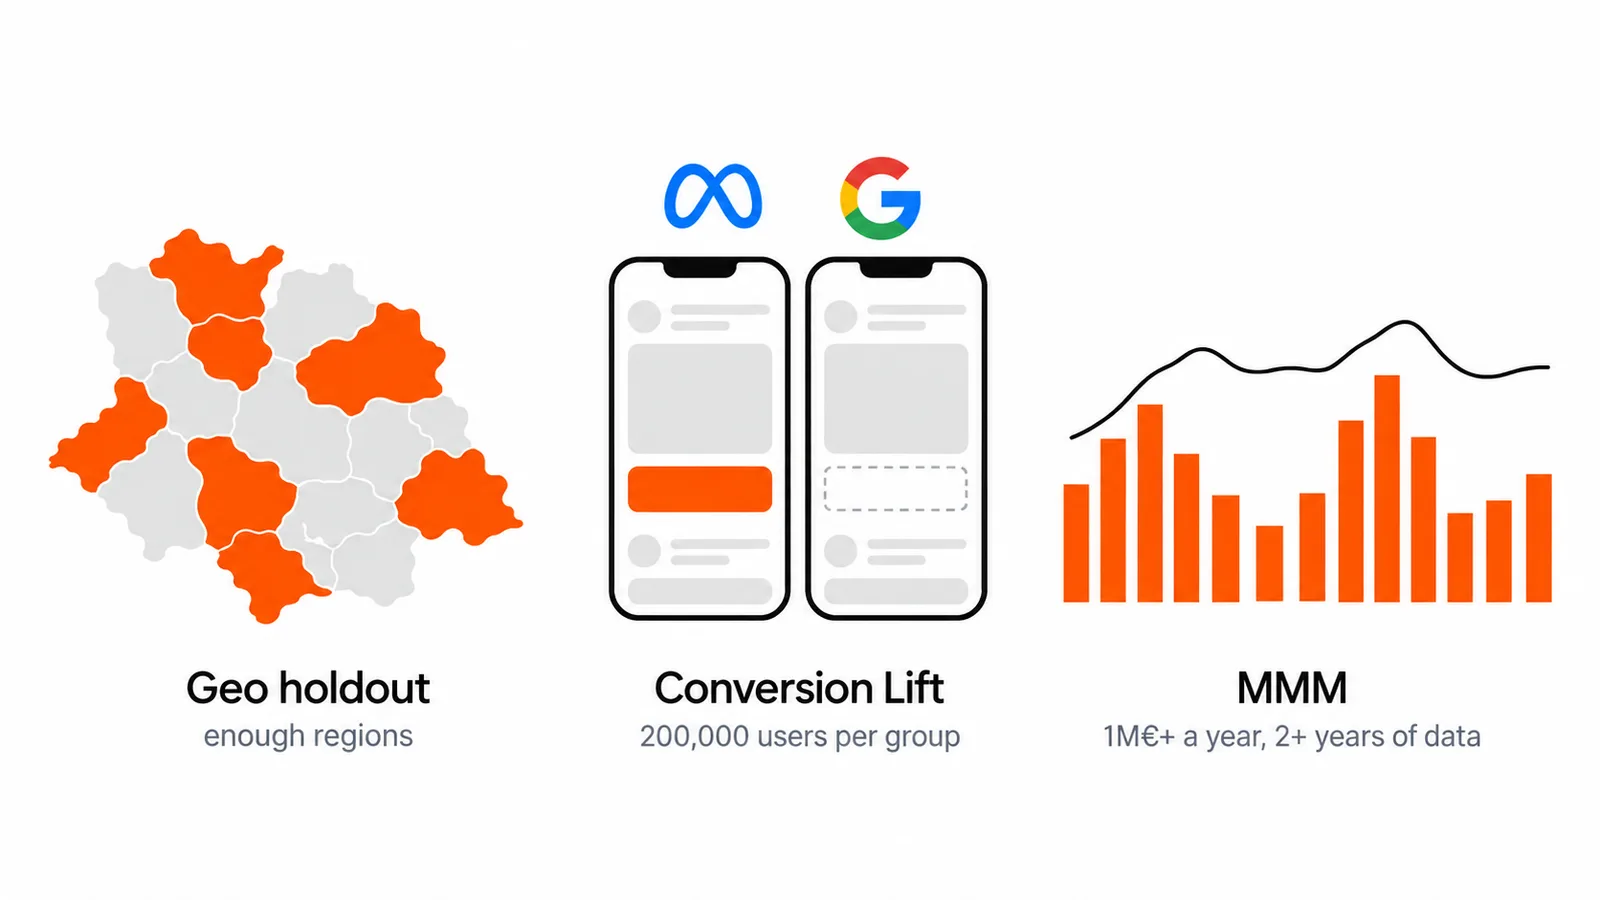
There is no single button for this. Three methods dominate in 2026, and they answer different questions.
1. Geo holdouts (geo-lift)
Split your regions into two comparable groups. Keep a channel running in one, hold it back in the other, and measure the sales difference. The gap is the incremental effect.
Geo holdouts are the most flexible option because they work for any channel, including offline and channels the platforms cannot measure post-iOS. They do not depend on user-level tracking at all, which makes them privacy-durable. The cost is that you need enough regions with enough volume to build matched groups, and you have to design the split carefully so the two groups really are comparable.
In 2026 Google announced Meridian GeoX, a publisher-agnostic way to run geo experiments across any channel, not just Google. The mechanic is the same as any geo holdout: change exposure in one set of geographies, measure the gap.
2. In-platform Conversion Lift (ghost ads)
Meta and Google can run randomized experiments inside the platform. The cleanest version uses ghost ads: the platform picks a control group that would have seen your ad, records the ad it would have shown, but withholds it. It then compares conversions between the exposed group and that control at the exact point where the only difference is the impression itself. That isolates the value of the ad.
This is the most rigorous read of a single platform’s incremental value. The catches are practical. A Conversion Lift test needs real scale to reach significance, on the order of 200,000 users per group, and it should run long enough to capture delayed conversions, not just the first two weeks. It also understates lift slightly, because conversions from users who opted out of tracking never make it into the lift tables. Modeled data patches some of that gap, not all of it.
3. Media mix modeling (MMM)
MMM works top-down. It uses a statistical model of your total sales against your total spend by channel over time, plus external factors like seasonality and promotions, to estimate each channel’s contribution. It needs no cookies, no device IDs, and no consent signals, which is exactly why it is back.
MMM adoption roughly tripled in three years, from about 9 percent to 26 percent of organizations, after Google open-sourced its MMM library, Meridian, in late 2024 and dropped the cost of entry from a six-figure consulting project to a few weeks of in-house work. Meta’s Robyn did the same earlier for the open-source crowd.
MMM only earns its keep at scale: roughly 1M€+ in annual spend and two or more years of clean data. Below that, the model is fitting noise. Above it, MMM is the best tool for annual budget allocation across channels, including the ones you cannot experiment on cleanly.
The point is not to pick one. Attribution runs your daily bidding, incrementality validates the causal claims before you move real budget, and MMM allocates across the whole mix. The IAB’s 2026 State of Data report found only about 39 percent of organizations use all three together, even though they were built to answer different questions. That gap is the opportunity.
Five mistakes that quietly invalidate an incrementality test
A badly run test is worse than no test, because it gives you a wrong number with a confidence interval attached. These are the failures I see most often.
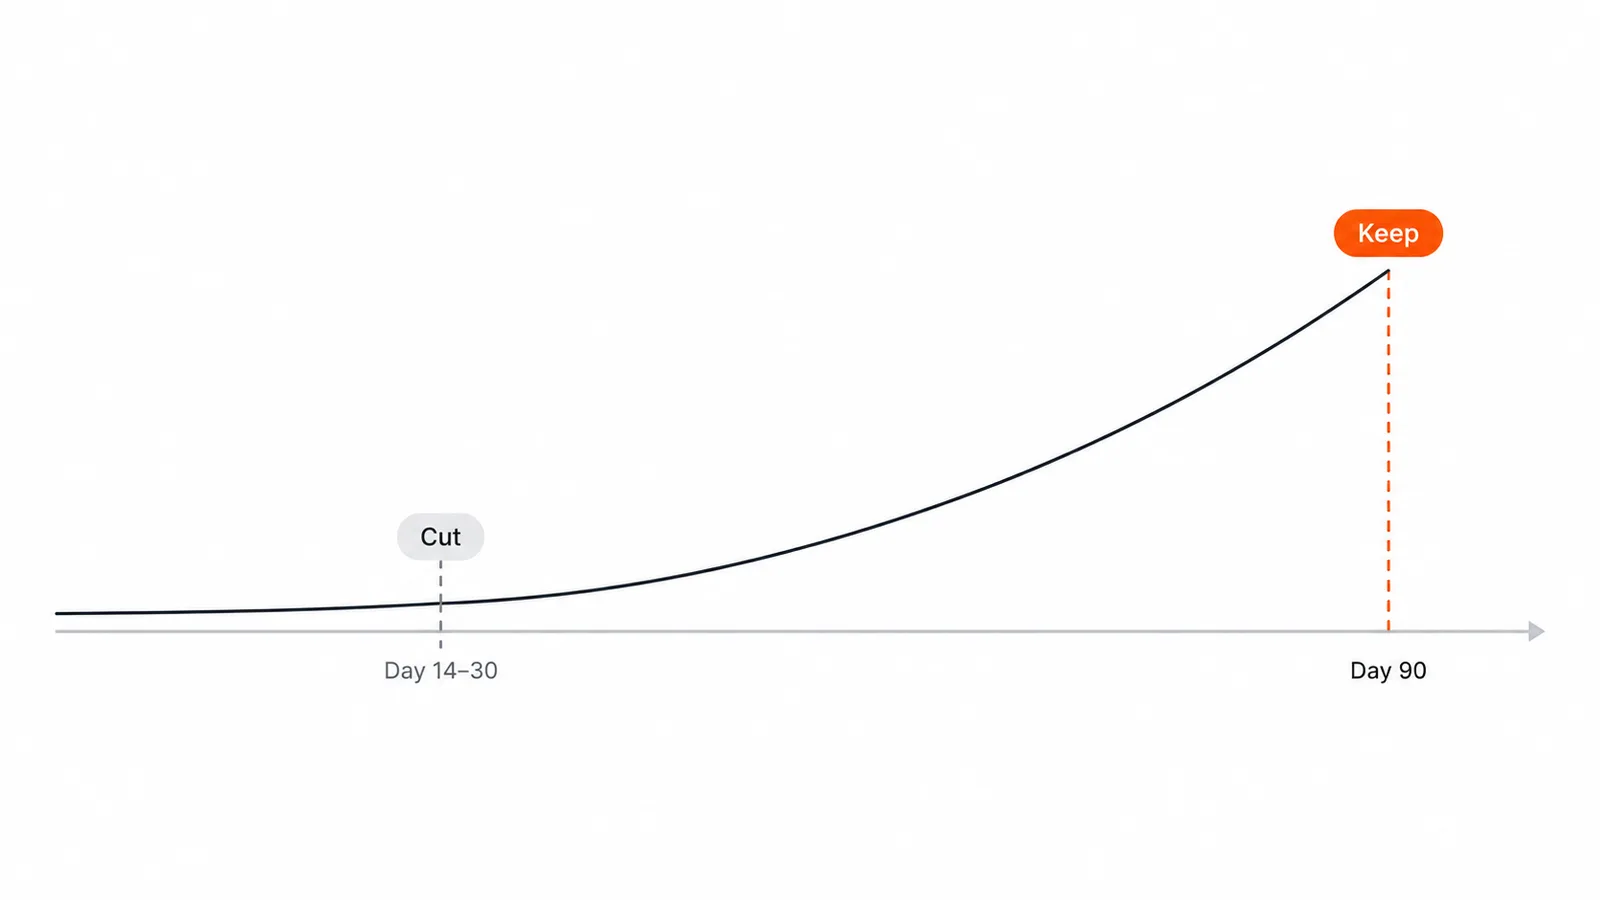
1. Reading the test too early. Incremental ROAS matures. A channel can look barely incremental at day 14 to 30 and prove clearly incremental by day 90, especially when the purchase cycle is long. Read at fixed maturation windows, not on the first read that happens to look conclusive. Reading too early is the most common way a good channel gets killed.
2. Letting prospecting and remarketing audiences overlap. If a large share of your holdout is still being reached by another one of your campaigns, the control is contaminated and you will underestimate lift. Exclude the holdout dynamically across every account before you start.
3. Trusting a stale multiplier. An incrementality multiplier from an old test, on a different channel or a different region, is a guess wearing a number. Buying decisions get made on it for years. Re-measure on a cycle. A small always-on holdout of a few percent keeps the number current instead of frozen in a spreadsheet from two years ago.
4. Running the test during an abnormal period. A product launch, a price change, a seasonal spike, or a campaign paused mid-test all break the business-as-usual assumption the test depends on. Lock the window and keep the account boring for its duration.
5. Sizing the holdout wrong. Too small and you never reach significance. Too large and the revenue you withhold costs more than the answer is worth. Holdout sizing is a power-versus-opportunity-cost tradeoff, and it is worth doing that math before you start, not after you have burned four weeks.
How to choose: attribution, incrementality, or MMM?
A simple decision guide:
- Reach for attribution when you need speed and granularity: daily optimization, in-platform bidding, spotting a broken campaign. Use it knowing it is directional, not truth.
- Reach for incrementality when a budget decision is on the line. Before you scale a channel or cut it, prove it actually causes conversions. This is where holdouts earn their cost.
- Reach for MMM when you are allocating budget across the whole mix at a yearly rhythm and you have the scale and data history to support it.
A practical budget rule for incrementality: if a single channel is spending under roughly 40.000€ a month, a full paid study is usually not worth it yet. Run a free in-platform lift test instead and revisit when the channel is bigger.
This mix of reconciling platform claims, designing holdouts, and calibrating attribution against test results is exactly the work behind our attribution and incrementality service. The goal is never a prettier dashboard. It is a reallocation plan you can defend.
What to expect when you run your first test
The first honest incrementality read is usually uncomfortable, because it tends to shrink the channels leadership is proudest of. That is the point. A test that only confirms what the dashboard already said did not tell you anything new.
Expect a few weeks per test, a clear before-and-after on the channel you held back, and an incremental ROAS with a confidence interval rather than a single tidy figure. Expect to read it more than once as conversions mature. And expect the first result to change at least one budget decision, because if it does not, your attribution was already close to reality, which is rare.
The output that matters is not the iROAS number itself. It is the decision it unlocks: move spend off the channels that were barely incremental, usually brand search and retargeting, and into the ones that actually grow revenue.
FAQ
What is incrementality in marketing?
Incrementality is the share of your conversions that would not have happened without the ad. You measure it by comparing a group that saw the ads with a comparable group that did not (a holdout), and the difference is the incremental lift. It answers the causal question attribution cannot: did the spend create the sale, or would the customer have bought anyway?
What is the difference between incrementality and attribution?
Attribution assigns credit for a sale to a touchpoint using a rule you chose. Incrementality proves whether the ad caused the sale by holding it back from a comparable group and measuring the difference. Attribution is correlation; incrementality is causation. A conversion can be credited to a channel that would have converted anyway. Only a holdout test tells you which.
Is my Meta or Google ROAS real?
Partly. Platform-reported ROAS is usually inflated, worst on brand search and retargeting, because those channels harvest demand that already existed. Across published studies, true incremental ROAS tends to land 30 to 60 percent below the reported figure. The reported number is not fake, it is just measuring credit, not cause.
How does a geo holdout test work?
You split your regions into two comparable groups, keep a channel running in one, and hold it back in the other. The difference in sales between the groups is the channel’s incremental effect. Because it does not rely on user-level tracking, a geo holdout works for any channel, including offline, and survives privacy restrictions.
How much budget do I need to test incrementality?
It needs scale. As a rule of thumb, if a single channel spends under roughly 40.000€ a month, run a free in-platform lift test rather than paying for a full study. In-platform Conversion Lift tests also need meaningful user volume, on the order of 200,000 users per group, to reach statistical significance.
Do I need media mix modeling (MMM)?
Only at real scale: roughly 1M€+ in annual spend and two or more years of clean data. Below that, the model fits noise. Above it, MMM is the strongest tool for annual budget allocation across channels, and it needs no cookies or consent signals, which is why adoption has tripled since 2024.
Which incrementality method is most reliable?
There is no single best platform or method. Geo holdouts are the most flexible and privacy-durable, in-platform Conversion Lift gives the cleanest read of a single platform, and MMM allocates across the whole mix. The most reliable setup uses all three together and cross-checks them, rather than trusting any one in isolation.
Key takeaways
- Attribution decides who gets credit. Incrementality decides what the ad caused. Do not read one as the other.
- Last-click is a policy, not a fact. It over-credits the channels closest to the purchase and hides the ones that created the demand.
- Platform-reported ROAS runs 30 to 60 percent above true incremental ROAS, worst on brand search and retargeting.
- Three methods measure lift: geo holdouts (flexible, privacy-durable), in-platform Conversion Lift (cleanest single-platform read), and MMM (top-down allocation at scale).
- Most failed tests fail for the same reasons: read too early, contaminated holdout, stale multiplier, abnormal test window, wrong holdout size.
- The honest setup is triangulation, not one source of truth. Attribution for the day-to-day, incrementality for the causal checks, MMM for allocation.
You already know your dashboards do not agree. The real question is which decision you are about to make on top of that.
Every month you run budget on a number that measures credit instead of cause, you move real money toward the wrong channels, and that spend does not come back. Before you scale a channel or cut one, find out whether it actually causes the sales it is getting credit for. Sometimes a free platform lift test answers that. Sometimes it takes a proper holdout. Either way, check before you move the budget, not after.